Clear communication requires full Transparency
There are two sides to the coin of Direct Democracy, Process control and full Transparency
With clarity comes the right decision
- You’re fed up with politicians hiding bad news or spinning figures so you never really know what’s going on — with full transparency you’ll get a clear public dashboard showing exactly how the government is performing on the priorities you set.
- You want to see real progress on things like NHS waiting times or fixing the roads, not just press releases — you’ll be able to check live scorecards any time, with honest numbers and simple explanations.
- You’ve lost trust because governments keep moving the goalposts — under our system, the targets are locked in by you, and politicians can’t quietly change or bury the results.
Transparency is at the heart of everything we do.
Once you, the public, set the nation’s Top 10 priorities, the government will be required to publish clear, honest and easy-to-understand performance data for everyone to see. No more smoke and mirrors, no more selective statistics, and no more hiding behind jargon.
We will create public dashboards and regular reports that show real progress (or lack of it) in plain English. This means politicians and civil servants are held accountable every single day — not just at election time. When you can see exactly what’s happening, trust can start to return and real change becomes possible.
The importance of Transparency in Continuous Improvement
At The Process Party, we believe that transparency lies at the heart of successful continuous improvement and effective governance. In an ever-evolving world, society needs the right information at the right time and this comes from a transparent Democratic process.
It not only builds trust but also nurtures innovation and collaboration within a society to improve cohesion and properly assess the efficacy of the ruling party's performance.
With a dedicated focus on monitoring processes, we ensure that every step aligns with the goals of our society.
Below is a detailed breakdown of how we will drive transparency in governance looking at the key tools that help scope, define, and align goals to actions and performance.
Our structured KPI tree serves as a vital tool, outlining key performance indicators that help us assess our impact and efficiency. Through this organized approach, we deliver the opportunity for citizens to be productively informed.
At The Process Party, we are not just about promises; we are about delivering results through transparency. By making our processes visible and understandable, we empower everyone involved to engage meaningfully in the journey of improvement, creating a more efficient and responsive environment for all.

Enhancing Govenment performance Through KPI Monitoring and Business Intelligence
At The Process Party, we believe that a clear understanding of Key Performance Indicators (KPIs) is essential to aligning government functions with the needs and aspirations of the people. Our aim is to align effective KPI's to the people's top ten goals identified by the population, providing transparency and insight into governmental performance. This is the essential other side of the coin to sustain a continnuously improving clean system.

What Are KPIs?
Understanding Key Performance Indicators
KPIs are measurable values that demonstrate how effectively a company, department, or individual is achieving key business objectives. In a governmental context, they reflect the community's aspirations and serve as a foundation for accountability.

Input Process Output
What scope do we need to monitor?
To make transparency effective, we need to be able to fully understand the full scope of what happens from our actions.
At the Process Party, we believe it's vital to cover the full scope of Government actions which can be split into 3 main categories:
The Inputs into decision making
The Process of implementing
The Outputs/results of the actions the Government take
Business Intelligence
Utilising technology for realtime anlysis
By implementing structured processes in KPI monitoring, we can significantly enhance the efficiency of government functions.
Business Intelligence is simply the name of the tool used to collate disparate data sets to deliver indepth insights in real time to ensure effective monitoring. This leads to more effective responses to community needs and better-quality services for all society.
KPI Tree
Aligning KPIs with Societies Priorities
It is crucial that the KPIs we monitor directly pertain to the priorities of our community. KPI Tree's are a crucial mecahnism to ensure that the strategic goals set are aligned throughout the Government.
Where the scope of Government actions are covered in the Input-Process-Output methodology, the depth of the scope is covered by the KPI Tree. Below is a broken down explanation of how a KPI tree aligns all behaviours to the Government's core goals. With Direct Democracy, this means that the goals we set are driven through and measured on the Government.
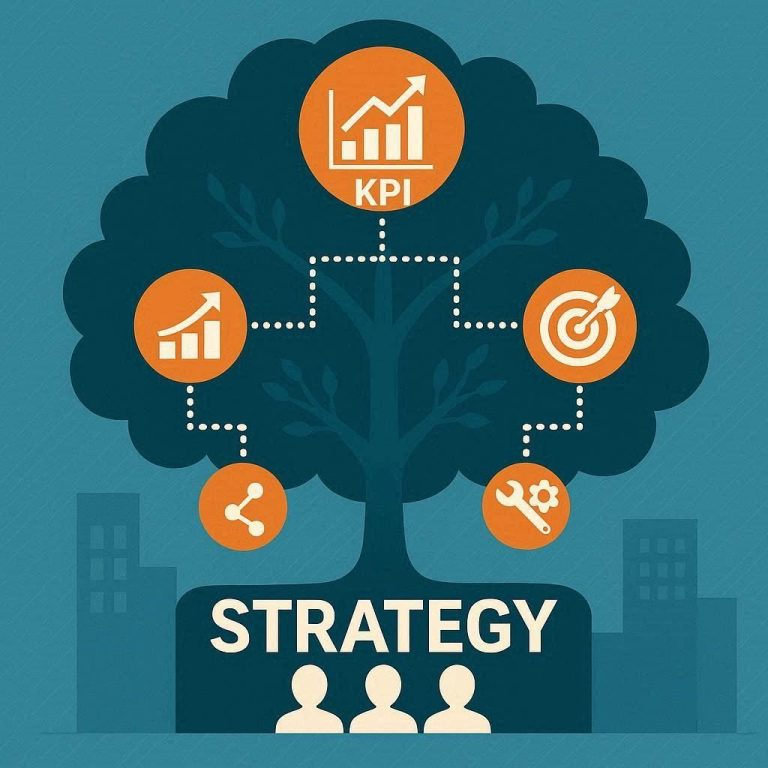
What are KPI's?
Understanding a powerful tool to give you insights without effort
Key Performance Indicators (KPIs) are simple, measurable values that show how well a goal is being achieved. For example, a hospital might track waiting times, or a transport system might track delays.
This also applies to Government and politicians.
KPIs are beneficial because they turn complex activity into clear, trackable results. They help identify what’s working, what isn’t, and where action is needed. For decision-makers, KPIs provide evidence to guide policies and spending. For society, they improve transparency—people can see whether services and systems are delivering real outcomes.
To implement KPIs effectively, organisations should:
- Set clear, specific goals
- Choose a small number of relevant metrics
- Track them regularly with reliable data
- Review and adjust based on results
When used well, KPIs align priorities, improve accountability, and encourage continuous improvement—benefiting both leadership and the wider public.
Sources & further reading:
- National Audit Office – Performance measurement guidance: https://www.nao.org.uk
- OECD – Government performance frameworks: https://www.oecd.org/gov/performance/
UK Government – Outcome Delivery Plans: https://www.gov.uk/government/collections/outcome-delivery-plans
The Scope of transparency - Input Process Output
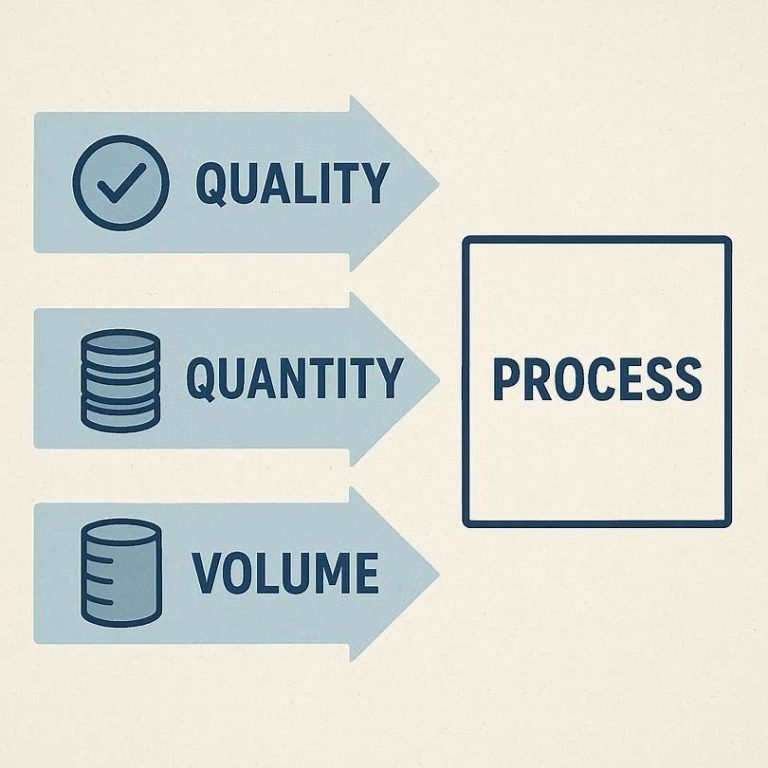
Inputs
Measuring the quality, quantity, and volume of the resources needed
Inputs are all the things needed to run the Government. When inputs are not properly scoped the projects and processes are susceptible to unforeseen inefficiencies that can lead to ever growing costs and/or reduced quality. By specifically measuring out these factors we learn to cover all potential outcomes of the process. Of course nothing is perfect, but a systematic recording and development of the way we measure, ensures continuous evolution for each new contract. This must be accompanied by clear transparency throughout the process (click here for more details around transparency).
Case Study
HS2’s northern phases were cancelled in 2023 after costs escalated far beyond initial estimates. Phase 1 alone rose from ~£20bn (2012) to potentially £80bn in current prices, driven by inflation and delays.
A key issue was poor contract management: contracts were let before designs were finalised, shifting risk onto the government and reducing incentives for cost control.
Reviews also found weak oversight and ineffective commercial arrangements, contributing to billions in overruns and renegotiations.
These failures made the full scheme unaffordable, leading to its scaling back and partial abandonment.
Source: House of Commons
Process -
Measuring the way Governance performs
The process is all the government functions and management. The depth of this scope will be covered in the KPI tree explainer (found here) but it is imporatant that we understand the internal workings wih real time information presented through business intelligence. The process is vital to collate all the performance data on the application of the people's needs.
How well are the leadership managing their resources and staff?
How are measurements assesed and how does performance align to these (KPI's again)
Over time, where are we seeing improvements and where are we seeig declines in process performance.
There are many levels of processes ut the structure
Case Study
The UK’s rising welfare bill reflects not just economic pressure but weak process oversight. Reports by the National Audit Office show persistent issues in monitoring eligibility, tackling fraud, and managing complex systems like Universal Credit. Delays, administrative errors, and limited real-time data have allowed costs to grow unchecked. Without stronger performance tracking and accountability, inefficiencies compound over time—contributing to welfare spending increasing faster than intended and, ultimately, placing greater strain on public finances.
Source: National Audit Office (PDF)
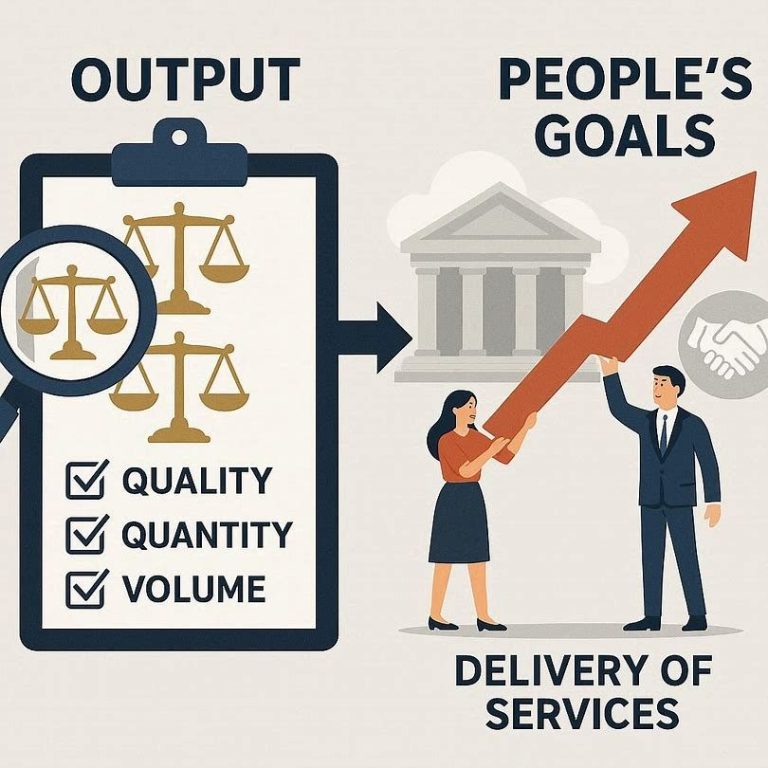
Output -
Measuring the quality, quantity, and volume of legislation, and delivery of services and the people's goals
The final consideration in the scope of transparency is the outputs. We cannot be mislead by false information around how well a project has been implemented, the effects of that implementation, the efficacy and return on the people's investment into infrastruture and other forms of spending. This section is actually a to way street to make it work. By this we mean that society needs unbiased and factual measurements on outputs
But sciety also needs to know how to interpret these outputs in relation to their own lives. Please see our process maps Flow 1 to fully understand how the Process Party suggests the best way to assess personal growth.
Case Study
The output of legislation being measures:
The introduction of the Off-Payroll Working Rules (IR35 reform). Communication and guidance to contractors and businesses were widely criticised as unclear and incomplete. The National Audit Office found many organisations struggled to assess employment status correctly, leading to blanket decisions and reduced contractor opportunities. This created labour shortages in key sectors and reduced flexibility in the workforce, showing how poorly communicated regulatory assessments can produce wider economic disruption.
Source:
The National Audit Office found HMRC increased guidance, stakeholder engagement, and support tools (like the CEST checker) after earlier criticism. It also highlighted improved phased implementation—the private-sector rollout was delayed by a year (to 2021) to allow better preparation.
However, the Public Accounts Committee concluded that core issues persisted, including unclear status assessments and limited accountability for incorrect decisions.
Sources:

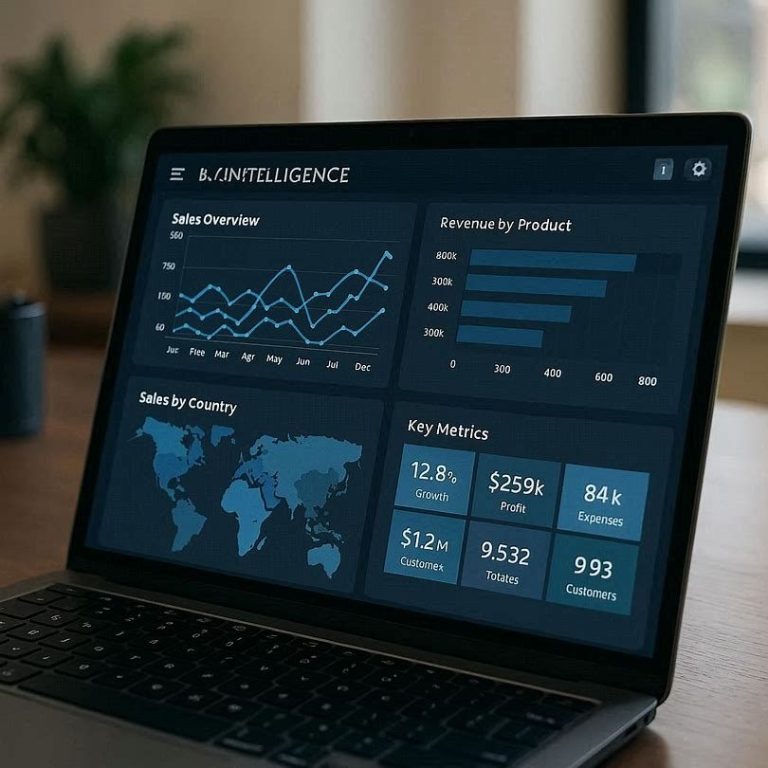
Business Intelligence
Business Intelligence
Business Intelligence (BI) refers to the tools and processes used to collect, analyse, and present data so organisations can make better decisions. It often includes dashboards, reports, and data visualisations that turn raw data into clear insights.


BI is beneficial because it helps organisations understand trends, spot problems early, and make evidence-based decisions. For decision-makers, it reduces guesswork and improves strategic planning. For society, better-informed organisations can deliver more efficient services, reduce waste, and improve outcomes.
To implement BI effectively, organisations should:
Gather reliable, relevant data
Use clear dashboards and visual tools
Ensure data is updated regularly
Train staff to interpret and act on insights
When used well, BI improves transparency, efficiency, and accountability—helping leaders act faster and more effectively while delivering better results for the public.
Sources & further reading:
Gartner – BI and analytics insights: https://www.gartner.com/en/information-technology/glossary/business-intelligence-bi
Microsoft – BI overview: https://learn.microsoft.com/en-us/power-bi/fundamentals/
IBM – What is business intelligence: https://www.ibm.com/topics/business-intelligence
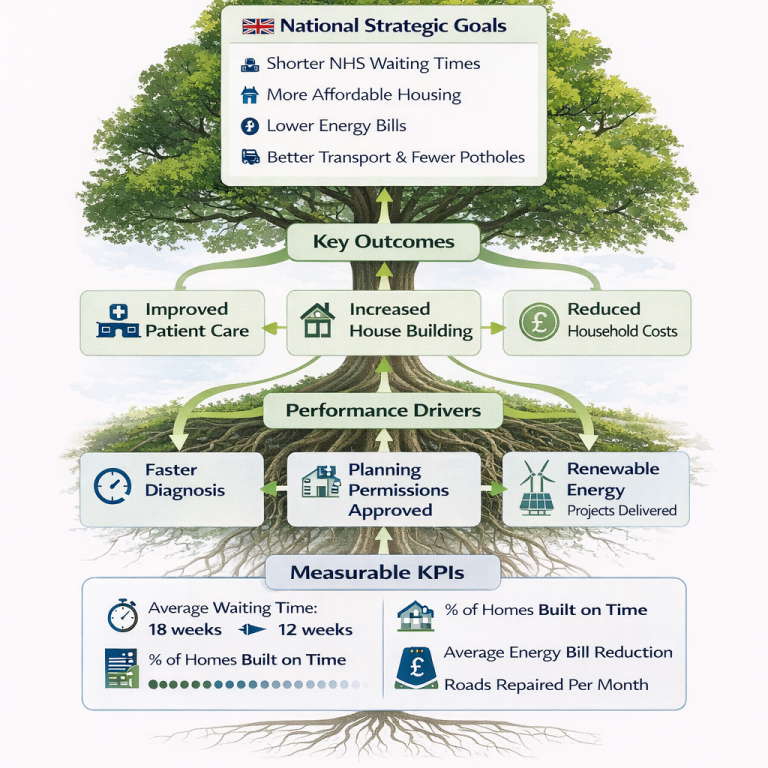
Strategic Goals
The strategic goals lead all the Tree's development and are set by us the people in the referendum
The purpose and use of a KPI Tree
A KPI Tree work's in a very logical way that follows a set pattern to ensure the goals are never lost throughout all levels of Performance review. This means that all our taxes can be directly linked to how they are spent and allows us to easily monitor the performance of Government without effort or time needed.
Here are the main rules for creating an effective KPI Tree that the Government will have to abide to so you can see how it helps push politicians to constantly be focused on achieving for the people:
- Start at the top — Begin with 1–3 clear, high-level strategic goals or objectives (the “North Star”).
- Break it down logically — Decompose each goal into 3–6 key drivers or outcomes that directly influence it (keep levels balanced).
- Make every level measurable — Ensure lower levels lead to specific, quantifiable KPIs that can be tracked over time.
- Show clear cause-and-effect — Use arrows or branches to demonstrate how lower KPIs drive the ones above them.
- Keep it simple and focused — Limit the tree to what really matters — avoid clutter with too many branches or unnecessary metrics.
- Make KPIs actionable — Each metric should clearly show what needs to improve and who can influence it.
- Ensure balance — Cover different aspects (e.g. cost, quality, speed, satisfaction) so the tree doesn’t become lopsided.
- Assign ownership & targets — Link each KPI to clear owners, realistic targets, and regular review.
- Test and refine — Check that the tree is realistic, then review and update it regularly as priorities change.
- Keep language clear — Use plain, precise wording that everyone (including non-experts) can understand.
Managerial Objectives
Once the goals are set, the Political party in power must develop out the sub branches of the tree and easily show how they align to our goals. These typically will cover the Cost, Quality, Quantity, and volume metrics that explicitly express how they will achieve our goals without waste
Operational Tasks
Then the Party in power will work with civil service on operational effectiveness KPI's. These bottom layer KPI's drive "on the ground" performance, aligning responsibility for performance through targets in day to day operations.